
|
|---|
|
|
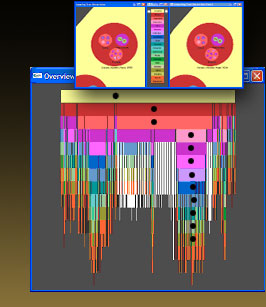
THE ZOOMOLOGY APPROACH In information visualization, displaying detail and structure of some 200,000 nodes in a single static view doesn't work for two fundamental reasons. Attempting to show full detail makes the representation too cumbersome to comprehend, while showing a broad overview hides too much detail to be useful for more than one or two types of task. The Zoomology approach is a hybrid of several known techniques built within an overview and detail framework. The role of the overview is to provide the “big picture” view of the structures, a map of the user’s navigation through the detail windows, and an indication of changed regions between the two trees. The detail view is reserved for exploring substructures and nodes within the hierarchies. Neither overview nor detail views may be capable of visualizing large tree structures on their own, but a combination of the two offers more than the sum of their strengths. Overview Zoomology’s overview is intended to show structure, show navigation in context, and indicate regions of difference. All of this is accomplished in a single view by constructing the union of the two trees. Both trees are mapped to a space-filling, multitree representation of the structure. Zoomology has a space-filling overview of the combined multitree. White areas indicate where changes occur between the trees. Navigation in the detail view is indicated by the superimposed paths. The drawing of Zoomology’s space-filling overview can be compared to the “slice and dice” algorithm used in treemaps. A given node in the graph is allocated a percentage of available space based on the number of nodes contained beneath it in the hierarchy. This technique is illustrated in figure 2, in which a traditional node-link diagram on the top is converted into a space-filling tree below it. As with the original Treemap, we require two traversals of a hierarchy. In the first pass, a post-order traversal allows us to count all the children, grandchildren, and so on, all the way down for every node in the tree. A second pass draws each node as a percentage of encompassed nodes as compared with its siblings. We borrow the multitree from the original idea presented by Furnas and Zacks at the CHI 1994 Conference. Because the data sets are so similar (88% exactly the same), drawing both hierarchies side-by-side would unnecessarily repeat most of the structure. Instead, we draw the union of both trees in one location with changes indicated in white. As shown in figure 1, this makes changed regions immediately identifiable in the context of the entire structure. The multitree overview saves space and makes finding differences between the data sets very easy. Paths are drawn on top of the overview to facilitate navigation. There are two detail views and, thus, two paths in the overview that are distinguishable by the shape of markers (triangle = data set A, square = data set B). This feature helps keep users from getting lost while browsing the trees. Paths encode both the current location and all nodes traversed along the way. Encoding structure effectively is the key challenge for the overview. Zoomology’s space-filling model guarantees that those portions of the tree that contain the most nodes will be allocated the most space and that the smallest portions will still be drawn in at least one pixel of the screen. Although portions of the hierarchy may be collapsed into a single pixel, we believe that this method of space allocation represents the relative size of nodes as accurately as possible given the lack of screen space. The result is a valuable estimation of structure in an overview with features to support both navigation and comparison of the two trees being visualized. Detail Zoomology’s detail view is a top-down navigation of the tree structures. Figure 3 depicts an immediate comparison of the two data sets as seen from the root node (Kingdom Animalia). Data set A is on the left and data set B on the right. The semantic-zoom interface is similar to those developed with the Pad++ line of applications [1] and, therefore, allows the user complete control of navigation within this view. Navigation through this interface is similar to flying through a tunnel. The user indicates where to fly and is smoothly zoomed towards more detail in the selected region. As a default, zooming in one tree zooms the other to the corresponding location. Figure 4 illustrates this zoom scenario. Differences between the two hierarchies are highlighted in the bottom panel of figure 4 by position and border color. To facilitate comparison between trees, enough space is left at the detail level to render all nodes present in both trees. Nodes that exist in one tree but are absent in the other are drawn with a white border. An empty space in a particular position indicates a node that is absent in one tree but present in the other. In this way, a unique node is highlighted in the correct tree and conspicuously absent in the other tree. In this detail view, an ellipse represents each classification node. As with treemap layouts, this containment relationship between a node and its children is similar to Venn diagrams. Figure 5 illustrates how a Venn diagram can represent the conventional node-link tree structure. The traditional node-link diagram on the left is converted into the Zoomology detail view on the right. The location and size of child nodes inside the parent node depends on the number of descendants. First, locations are assigned alphabetically left-to-right, top-down within the parent. Second, each of the locations is considered as a particle that pushes neighbors away to avoid overlap. Finally, to prevent particles from moving too far away, forces are added that attract particles toward the center. These complimentary forces will eventually move particles to equilibrium positions that are stored for use with future navigation. Because of the smooth, zooming nature of this view, child nodes never need to overlap. Labels disappear if extra space is needed to draw nodes. Nodes shrink and eventually disappear if too small or numerous to draw. As the user zooms in, however, details are revealed to the maximum extent possible in the current window. The containment relationship between parent and child nodes provides an effective paradigm for traversing the trees. Zooming is a very natural interface for exploration. In addition to simultaneous zooming in both trees, it is possible for a user to “unlink” the windows and explore one tree independently of the other. This could be useful for discovering the source of differences between two hierarchies. The user thus controls the exploration of tree structures while Zoomology provides redundant cues of position and border color to pinpoint difference. While the overview provides structure and navigation context, this detail view allows users to determine exact differences and similarities between trees at any level or location of interest. The “Smart” Legend As previously explained, color is a redundant cue for rank. As shown in Figure 6, however, our legend does more than just map color to the associated rank. Dynamic paths alongside the color-coded legend reflect navigation through the detailed views. The left path corresponds to the left window (data set A) and the right path is for the right window (data set B). These views are linked to zoom together, but nothing exists in data set A for the region being explored in data set B. The difference in zoom level is apparent by the extension of the path for data set B. Path information is useful for the following tasks: To what level am I currently zoomed? This last question is most important when the windows are not linked for concurrent zooming. It is expected that users will unlink the windows in order to find the location of a node that exists in different places in the two trees. Figure 7 shows the comparison of the same node in different places with different paths. The different paths are displayed in the central legend. In figure 7, for example, the order Macroscelidea is classified with a subclass and an infraclass in data set A that do not exist in data set B. The legend helps the user remember these differences and navigate between them as they explore. As we will see next, this legend also connects exploration in the detail views to the overview and vice versa. In fact, the “smart” legend is important functionally for bringing the entire visualization together. Interactions Interaction between overview and detail views enhances Zoomology’s usefulness. The overview combines both structures into a single view, but selection of individual nodes or comparison of their details is difficult. Rather, users click on regions of interest in the overview, and the detail view smoothly pans and zooms to that area. If the user selects a pixel that represents multiple nodes, the detail view zooms to their parent. Context and navigation history, missing from the detail views, are provided both in the legend and the overview. The legend shows the type of ranks traversed, and the overview shows specific location within the hierarchy. Thus, combining overview, detail, and legend helps overcome the limitations of each view by itself. Identifying a node is a task best achieved by the combination of all three views. Similarly, locating nodes in both trees is a task for all three views. When linked, detail windows zoom to the same location in both trees. Unlinking these windows allows the user to display different areas of detail in each tree. This might be used to locate a species that is situated in different areas in each tree. This is currently accomplished by clicking in the overview or navigating a detail view, but will be aided in the future by a text-based search. Once the node has been found, white borders in the detail views as well as paths in the legend and overview encode difference. Thus, each view supports the others, providing alternate navigation choices and supporting information to aid insight into the data. |